
Embla Medical's prosthetics device sales grew 7 percent in Q3 2026. The company's patient care segment grew zero.
Embla Medical posted $250 million in Q3 2026 sales, with its prosthetics and neuro orthotics segment growing at 7 percent organically. Its patient care segment, which covers owned O&P clinics, came in flat. That gap is worth understanding.
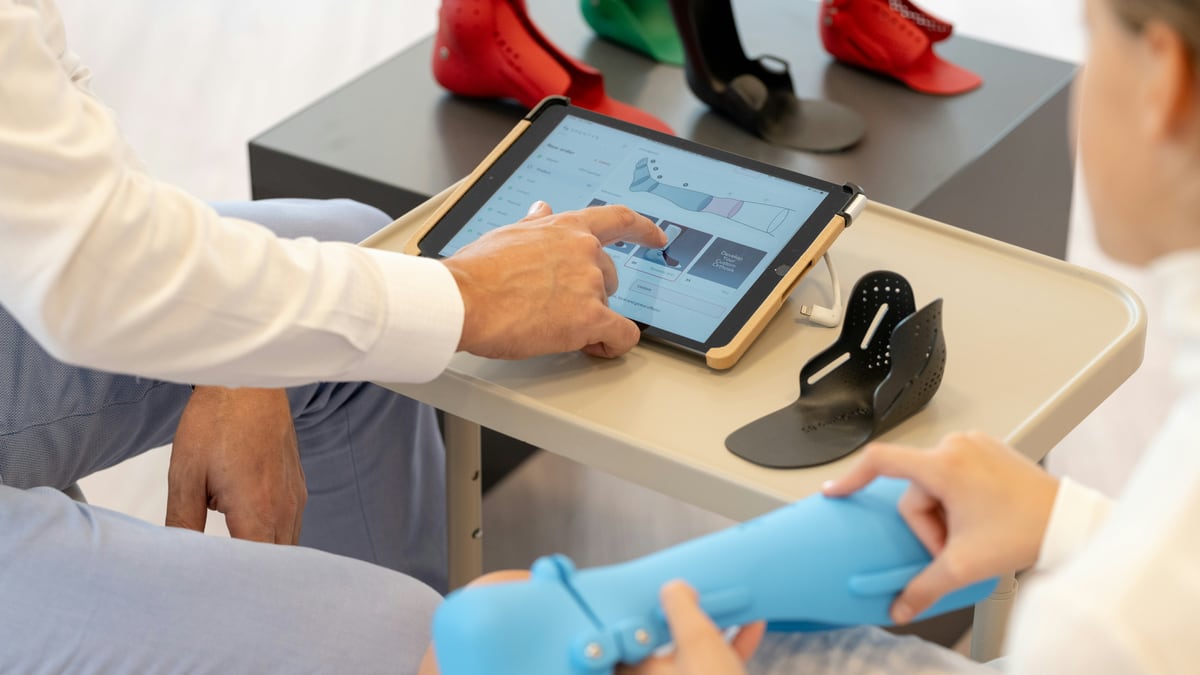
Embla Medical’s third-quarter 2026 financial results, posted this week by The O&P EDGE, describe a company with $250 million in quarterly sales and three segments moving at three different speeds.
The prosthetics and neuro orthotics segment grew 7 percent organically. Bracing and supports grew 2 percent. Patient care grew zero percent.
The device side of the business is expanding. The clinic access side is not moving.
What “patient care” means in this context
In O&P company financials, “patient care” refers to owned and operated clinics where prosthetists see patients. These are not device sales. They are the appointments, fittings, and follow-up visits that turn a prescription and a component into something a person can actually use.
An O&P company that also owns clinics is running two distinct businesses: manufacturing and distributing components, and delivering clinical care. Embla’s Q3 results separate these, and the separation matters because the two segments answer different questions.
Device sales tell you something about demand in the broader prosthetics market, including from independent practitioners who buy components but are not counted in “patient care” revenue. Patient care revenue tells you something about access through the company’s own clinical network specifically.
The gap between device demand and clinic volume
A 7 percent organic growth rate in prosthetics and neuro orthotics means device sales are expanding, whether through volume, pricing, or product mix. Independent O&P practitioners, hospital systems, and international markets can all drive that number without a single Embla-owned clinic seeing one additional patient.
Flat patient care revenue means the owned clinics are not growing on any of those same dimensions: not more patients, not higher billing per visit, or some combination of both. The Q3 report does not explain which. It reports the segment number and moves on.
Possible explanations include staffing constraints at owned locations, payer reimbursement structures that limit per-episode revenue, geographic concentration in markets with flat demand, or deliberate portfolio management. None of these is speculation; all are documented patterns in the O&P clinic business generally. Which one applies here is not in this earnings release.
What this means if you are trying to get an appointment
Positive device-segment growth at a major O&P company does not mean access to qualified O&P clinical care is expanding at the same pace.
Access to certified prosthetists is an ongoing problem, particularly outside major metropolitan areas. Wait times at O&P clinics have been a recurring complaint in patient advocacy for years. If the largest companies’ owned clinic networks are not growing, that constraint does not ease on its own.
Independent prosthetists and smaller O&P practices are the other half of the access picture, and they buy their components from manufacturers like Embla. Growth in device sales may reflect real growth in that independent channel. What Embla’s Q3 results cannot answer is whether the overall number of O&P encounters is increasing, holding steady, or contracting.
The broader financial picture
The overall company grew 4 percent organically and 5 percent in reported local currencies. Gross margin was 62 percent, down from 63 percent in Q3 2025. Net profit came in at $26 million, a 10 percent margin compared to 11 percent in the same period last year. Free cash flow was $31 million, or 12 percent of sales, compared to 16 percent in Q3 2025.
None of those moves suggest serious financial stress. Net debt to EBITDA of 2.1 times sits within the company’s stated target range of 2 to 3 times. The company also repurchased 635,267 shares at a market value of $2.8 million during the quarter.
The trend on cash generation is worth watching for anyone tracking whether a major O&P company has the capacity to reinvest in clinical infrastructure. The Q3 data alone is not enough to answer that question. But it puts the patient care segment’s flatness on the record.
Source notebook: This reporting draws on The O&P EDGE: Embla Medical Posts 3Q 2026 Financial Results, October 2026 ↗. We link out so you can follow the receipts.